The Birds You Didn’t Count: A Winter Estimating Game at Watermead
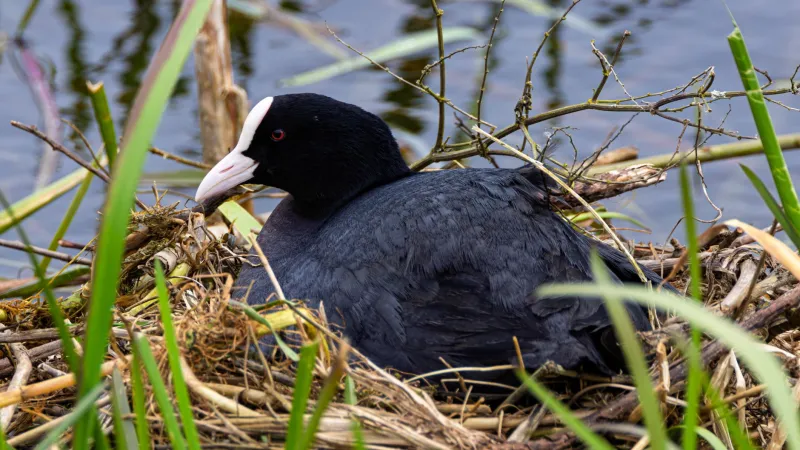
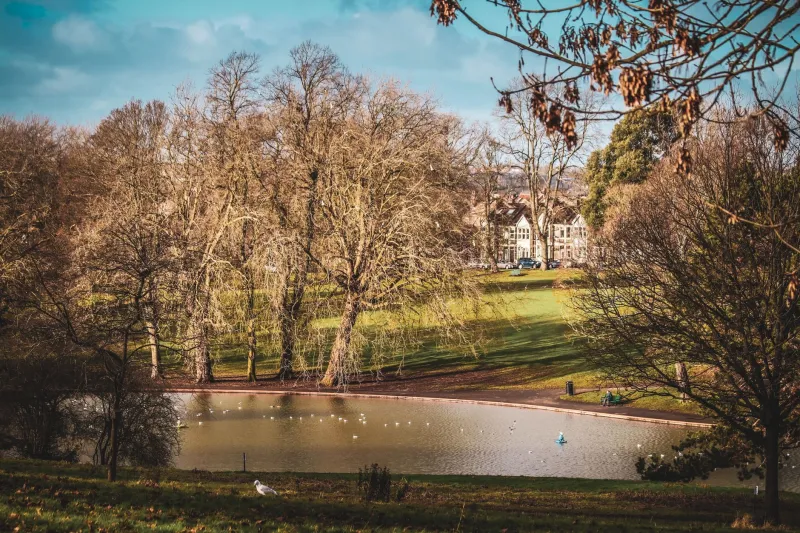
Watermead in winter is a moving target. One minute the lake is a grey sheet of water; the next it is a raft of coots, tufted ducks and geese, all drifting about like loose change. You could try to count every bird, but by the time you reach the far reedbed the first lot have swum somewhere else. This is exactly the sort of problem that makes maths useful: not counting everything, but working out what a sensible sample can tell you.
Why not just count every coot?
A full count sounds honest, but in practice it is expensive, slow and disruptive. Birds move, hide behind islands, take off, land again, and generally refuse to arrange themselves in rows. Large wetland sites such as Watermead Country Park are also big enough that a single observer cannot be everywhere at once. Conservation organisations therefore rely on samples, indices and estimates. The monthly Wetland Bird Survey, known as WeBS, uses repeated counts from fixed viewpoints to track waterbird numbers over time. Those counts are valuable, but they are not a census of every bird in the country.
That distinction matters. A count is a measurement; an estimate is an inference. Both are useful, provided you know which one you are looking at.
The maths in a bag of beans
The classic way to estimate a population without counting it all is capture–recapture, often called the Lincoln–Petersen method after work done in the 1890s and 1930s. The idea is simple. Catch a sample, mark them, release them, then catch a second sample and see how many are already marked.
If a large proportion of the second sample is marked, the population is probably small. If only a few are marked, the population is probably large. The formula is:
N ≈ (M × C) ÷ R
Here, M is the number of animals marked in the first sample, C is the total number caught in the second sample, and R is the number of marked animals recaught in that second sample. N is the estimated population size.
You can try this at the kitchen table with dried beans. Put 250 beans in a bag. Pull out 50, mark them with a felt-tip or swap them for red beans, then return them and give the bag a good shake. Now pull out another 50 and count how many are marked. Suppose you find 9. Then N ≈ (50 × 50) ÷ 9, which is about 278. Your estimate is a little high, but it is in the right ballpark. Repeat the whole process several times and you will see the estimates jump around. That variation is not a mistake; it is sampling noise.
If R is very small, the basic formula becomes unstable. A common refinement is the Chapman estimator:
N ≈ ((M + 1)(C + 1) ÷ (R + 1)) − 1
It is not magic, but it behaves better when recaptures are rare. For a family activity, the main point is not the algebra. It is the experience of watching an estimate wobble.
What the formula is really saying
The Lincoln–Petersen method assumes the population is closed, meaning no births, deaths, immigration or emigration during the study. It assumes every individual has the same chance of being caught, marks are not lost, and marked animals mix back in properly. Real coots do not read the assumptions. A bird near the path may be easier to see than one tucked into reeds. A flock may move between lakes. Bad weather may push birds into a corner of the reserve. Each of these breaks the tidy model.
That does not make the method useless. It makes it a model, with limits. Good field biology is partly about knowing when a rough estimate is good enough and when it is not. If you are tracking a common winter visitor across a large site, a rough index may be perfectly adequate. If you are managing a rare breeding species, you need something much more careful.
From kitchen table to Watermead
At Watermead you should not be catching coots. Wild birds should only be handled by trained, licensed people, and disturbance is a real cost to wildlife. Instead, use the reserve as a place to practise observation and sampling discipline.
Pick a viewpoint with a clear view of one bay or lake edge. Count all the coots you can see in a fixed ten-minute window and write the number down. Then move to a second viewpoint and do the same. Compare the two. Are they counting the same birds? Are some sectors easier to see than others? This is the sort of question that turns a walk into a survey.
If you are lucky enough to spot colour-ringed birds, you can think about how resighting works in real studies. But for most families, the capture–recapture lesson belongs at home with beans, counters or even pasta shapes. The field trip supplies the context: why sampling is necessary, why birds are hard to count, and why a number with an uncertainty attached is often more honest than a confident guess.
When the estimate lies
The most useful lesson is failure. Try the bean simulation with only a small second sample, or with a bag that has not been mixed properly. Watch the estimate go badly wrong. Then ask what went wrong. Did the marks clump together? Was the sample too small? Did the first sample change the population? These are exactly the questions field ecologists ask when a survey result looks odd.
Local conservation data depends on this kind of honesty. A bird report is not just a list of sightings; it is a record of effort, method and coverage. An estimate from a well-designed sample can be more useful than a heroic attempt to count everything badly. That is a genuinely mathematical idea, and it is one you can hold in a bag of beans.
A winter challenge
This winter, try a three-part challenge. First, run the bean simulation five times and record your estimates. Second, calculate the average and the range. Third, visit Watermead and make a careful sample count from one viewpoint, noting the weather, time and visibility. You will end up with a small dataset, a wobbly estimate and a much sharper sense of why ecologists talk about uncertainty rather than pretending they know everything. Coots, it turns out, are excellent teachers of applied maths — as long as you leave them alone to get on with being coots.