Mapping of Ratings results to
the Political Atlas of the World


Mapping of Ratings results to
|
  
|
The Political Atlas of the World is the joined project of Institute for Public Programming, Moscow State Institute of International Relations (MGIMO-University), and the ''Expert'' magazine. The major goal of this project is to discover various patterns and tendensies that are present in different political systems by means of the multivariate analysis. For 192 contries the data were collected and rated using 5 integral indices (index of state consistency, index of international influence, index of national theats, index of institutional foundations of democracy, quality of life). The results were published in the book "Political Atlas of the Modern World"(in english) and in the paper "Experience of Countries Classification" ( Mel'vil', A.Yu. etc. "Experience of Countries Classification". Polis 5, 2006 (in russian)).
On this web-site we represent the results of independent analysis of ratings for the Political Atlas of the World, that was performed using the methods of mapping and data visualization developed by Dr. A. Y. Zinovyev and Dr. A.A. Pitenko at the Prof. A.N. Gorban laboratory of Neroinformatics, Institute of Computational Modelling Russian Academy of Science, Krasnoyarsk. The detailed results of analysis could be found in the papers A. Zinovyev "Data visualization in political and social sciences" ( In: SAGE "International Encyclopedia of Political Science", Badie, B., Berg-Schlosser, D., Morlino, L. A. (Eds.), 2011) and "Mapping of Ratings results to the Modern Political Atlas" (in Russian).
 |
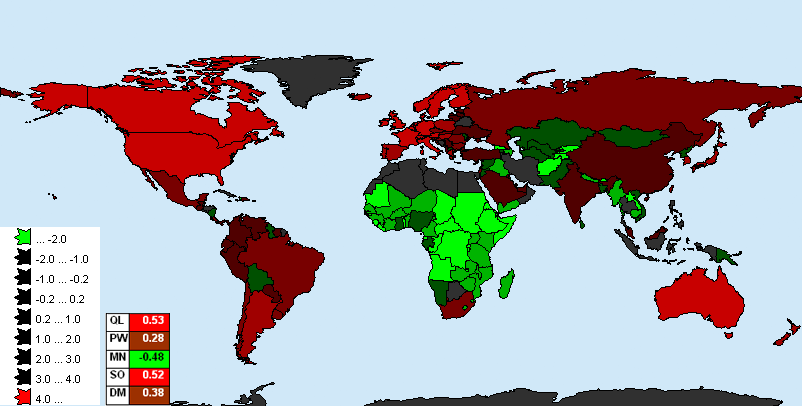
In this part the real geographic map is used for the visualization and interpretation of data. (please click the image) |
 |
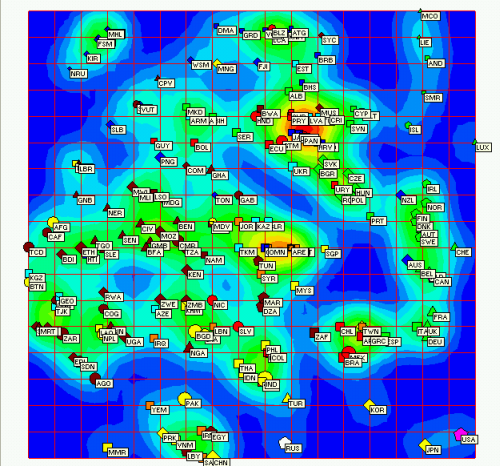
In this part the data were visualized by two-dimesional principal manifold ("Data Map") built by means of the Elastic Maps method. This manifold could be considered as a curved display embedded into multidimesional space of data. The Data Map approximates a multidimesional "cloud" of data and project data points onto two-dimesional surface.[A. N. Gorban, A. Y. Zinovyev, Principal Graphs and Manifolds, In: Handbook of Research on Machine Learning Applications and Trends: Algorithms, Methods and Techniques, Olivas E.S. et al Eds. Information Science Reference, IGI Global: Hershey, PA, USA, 2009, 28–59; A. N. Gorban, A. Zinovyev, Principal manifolds and graphs in practice: from molecular biology to dynamical systems, International Journal of Neural Systems, Vol. 20, No. 3 (2010) 219–232.] The distinct feature of the Data Map from geographic map is that on Data Map the closest objects (countries) have similar or equal values of attributes (indices) but they could be distant on georgraphic map. |
ViDaExpert 1.0 is unique software tool for visualization of multidimensional datasets. It allows to make understandable color illustrations of a dataset to explore it’s intrinsic patterns and regularities.The main technique implemented in ViDaExpert is the Method of Elastic Maps - advanced analogue of the Method of Self-Organizing Maps. Besides, there are many other methods of data analysis, including Principal Components Analysis, different clustering methods, Linear Discriminate Analysis, Linear Regression Method. You can learn much more about this from the following links:
ViDaExpert is avalable for download from the author's web-page
ALOV MAP:
ALOV MAP is free, portable Java® application for publication vector and raster maps to Internet and interactive viewing on web browsers. In this project it was used for the purposes of visualization of the analysis results on the world map.
The results were organized into the MS Access data base, which can be used for visualization in ALOV Map. For additional information about the results please contact the authors of this project: Andrei Zinovyev and Aleksei Kolodyazhnyi
Andrei Zinovyev
Aleksei Kolodyazhnyi