The Target That Moves: A Rainy-Day Cricket Puzzle from Grace Road
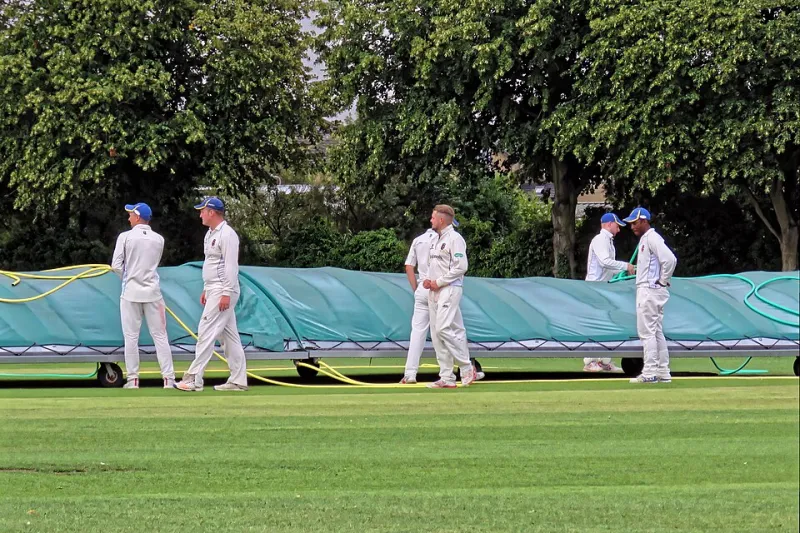
Photo: Acabashi, CC BY-SA 4.0, via Wikimedia Commons
Grace Road has a particular sound when rain arrives. First the umpires look at the sky, then the groundstaff sprint for the covers, then the crowd starts doing arithmetic. A match that looked simple at 2pm — chase 282, win the game — can become a puzzle by 4pm. The target on the scoreboard changes, the overs shrink, and suddenly everyone in the stand has an opinion about fairness.
That is the world of Duckworth-Lewis-Stern, usually shortened to DLS. It is cricket’s way of settling a simple question: if rain steals part of the match, what is a fair revised target? For maths students, it is also a lovely excuse to talk about resources, percentages, proportional reasoning and the difference between a model and a magic number.
The drizzle delay
Imagine a hypothetical 2026 One-Day Cup match at Grace Road. Leicestershire Foxes bat first and post 281 for 6 from their 50 overs. The visitors begin the chase. After 8 overs they are 48 for 1 when the rain arrives. The covers come on. The players go off. The scoreboard still says 282 to win, but everyone knows that number is about to become negotiable.
When play resumes, suppose the chasing side has 32 overs left. They have lost one wicket. The target will not stay at 282, because they no longer have the same resources they had at the start. But it will not simply drop by the proportion of overs lost either. Wickets matter. A team with 32 overs and nine wickets in hand is in a very different position from a team with 32 overs and only two wickets left.
Resources, not just runs
DLS treats an innings as a bundle of resources. The two ingredients are overs remaining and wickets in hand. At the start of a 50-over innings, a team has 100% of its resources. As overs are bowled, that percentage falls. As wickets are lost, it falls further. The official DLS tables are detailed and proprietary, but the idea is plain enough for a classroom: a team with more overs and more wickets has more chance to score runs.
So when rain interrupts, the question is not simply “how many overs are left?” It is “how much batting resource is left?” A shortened chase with wickets in hand can still be potent. A shortened chase with the tail exposed is much weaker.
From par score to target
DLS uses a par score to set the target. In a simplified version, if the first team had 100% of its resources and the chasing side is left with 70%, the par score is roughly 70% of the first innings total. The target is one run more than par. If the first team made 281, a 70% resource score would be about 197, so the target would be 198.
The real method is more precise, especially when wickets have fallen and interruptions happen mid-innings. But the core logic is proportional: compare the resources available to each side, then scale the first innings total. That is why a revised target can look strange. A chase that seemed to need 282 from 50 overs might suddenly need 192 from 32 overs. It can feel harsher, or occasionally kinder, depending on when the rain falls and how many wickets are already down.
Build your own resource table
Here is a classroom activity that works with GCSE students, maths club groups or a family audience. It does not try to reproduce the official DLS table. Instead, it asks students to build a simplified table and defend the logic behind it.
Start with a blank grid. Down the side, list overs remaining: 50, 40, 30, 20, 10. Across the top, list wickets lost: 0, 2, 5, 8. The top-left cell is 100%, because 50 overs and no wickets lost is the full resource. Now fill in the rest using three rules:
- Fewer overs left means less resource.
- More wickets lost means less resource.
- Every extra wicket should reduce the resource, but the drop should be bigger when the team is already deeper into the order.
A possible simplified table might look like this:
| Overs left | 0 wickets lost | 2 wickets lost | 5 wickets lost | 8 wickets lost |
|---|---|---|---|---|
| 50 | 100 | 92 | 72 | 38 |
| 40 | 90 | 82 | 64 | 33 |
| 30 | 77 | 70 | 54 | 27 |
| 20 | 58 | 52 | 40 | 19 |
| 10 | 33 | 30 | 23 | 10 |
These numbers are illustrative, not official. That is the point. Students can compare their table with another group’s and ask which one feels more realistic. Why should 20 overs and two wickets lost be worth more than 20 overs and five wickets lost? How steep should the drop be from 30 overs to 20 overs? There is no single perfect answer in a simplified model, but there are better and worse arguments.
The revised-target debate
Now give the groups a scenario. Team A scores 260 from 50 overs. Team B begins the chase, but rain reduces the innings to 30 overs with no wickets lost. Using the table, Team B has 77% of the first innings resource. The par score is 260 × 0.77 = 200.2, so the target is 201 from 30 overs. Team B has to score at 6.7 an over rather than 5.2. Is that fair? Why?
Then add a second shower. Team B is 70 for 0 after 10 overs when rain returns. They now have 20 overs left and still have lost no wickets. Their resource is 58%. The new par score is 260 × 0.58 = 150.8, so the target becomes 152. Team B needs 82 more runs from 20 overs. That is a rate of 4.1 an over. The target has fallen, but the required rate has fallen too. The game has changed shape.
Finally, change one detail. Suppose Team B was 70 for 3 instead of 70 for 0. With 20 overs left and three wickets lost, their resource sits between the two-wicket and five-wicket columns — perhaps around 48%. The par score becomes 260 × 0.48 = 124.8, so the target is 126. Team B needs 56 from 20 overs with seven wickets in hand. Is that easier or harder than the previous chase? Students have to defend their answer using the table, the required rate and the wickets remaining.
Why this belongs in a maths lesson
This is problem solving with a scoreboard attached. Students practise percentages, proportional reasoning, table reading, interpolation and argument. They also meet a bigger idea: mathematical models are not crystal balls. They are tools built on assumptions. DLS is sophisticated, but it still produces arguments. That is not a weakness of maths. It is a reminder that maths is often about making a reasonable model and explaining why it is reasonable.
So if you are at Grace Road and the covers come on, do not just groan. Watch the target. Ask what resource has been lost. Then see if you can work out why the number on the scoreboard has moved — and whether you would defend it.