The Nearest-First Map: Sketching Leicester’s Wards as Voronoi Cells
Photo: H.M., Public domain, via Wikimedia Commons
Ask a friend standing under the Clock Tower which council ward they are in, and you may get a confident answer. Ask them to explain exactly where that ward ends, and the confidence tends to wobble. Boundaries are strange things: invisible on the pavement, decisive on a polling card, and often drawn along features you would only notice if you were looking for them.
Here is a Leicester maths game that starts with a deceptively simple question. If you put a dot at the centre of every ward, which dot is any given point in the city closest to? Draw the answer and you get a Voronoi diagram — a map made entirely from the idea of nearest neighbour.
Start with a Leicester question
Imagine placing a marker at a useful local point for each ward: a library, a leisure centre, a community hub, a ward office. Now pick a spot — say the market, the station, the top of New Walk, the edge of Aylestone Meadows. Measure the straight-line distance from that spot to each marker. The nearest marker wins. Do this for every point in the city and colour each winning region differently. That is the Voronoi cell for that marker.
The name sounds technical, but the idea is wonderfully everyday. A Voronoi diagram asks: if you had to use the closest site, which one would you choose? Mobile phone masts, pizza delivery zones, fire station catchments and even the patches of a school playground can all be modelled this way. Leicester’s wards are not actually drawn like this, but the model gives us a sharp way to ask what a boundary is for.
What a Voronoi diagram actually is
In a Voronoi diagram, each site owns the region made of all points closer to it than to any other site. The boundary between two neighbouring cells is a straight line — specifically, the perpendicular bisector of the line joining their two sites. Where three cells meet, you get a corner. It is a beautifully clean construction: no politics, no rivers, no railway embankments, just distance.
That cleanliness is the point. A Voronoi diagram is a model, not a verdict. It lets you see the geometry underneath a map before all the real-world complications arrive.
A pencil sketch for a Leicester table
You do not need software to try this. Take a rough A3 outline of Leicester, or just a large sheet of squared paper with a few landmarks marked. Choose six or seven seed points spread around the city: perhaps the Clock Tower area, Belgrave, Evington, Aylestone, Rushey Mead, Knighton and Beaumont Leys. Mark them clearly.
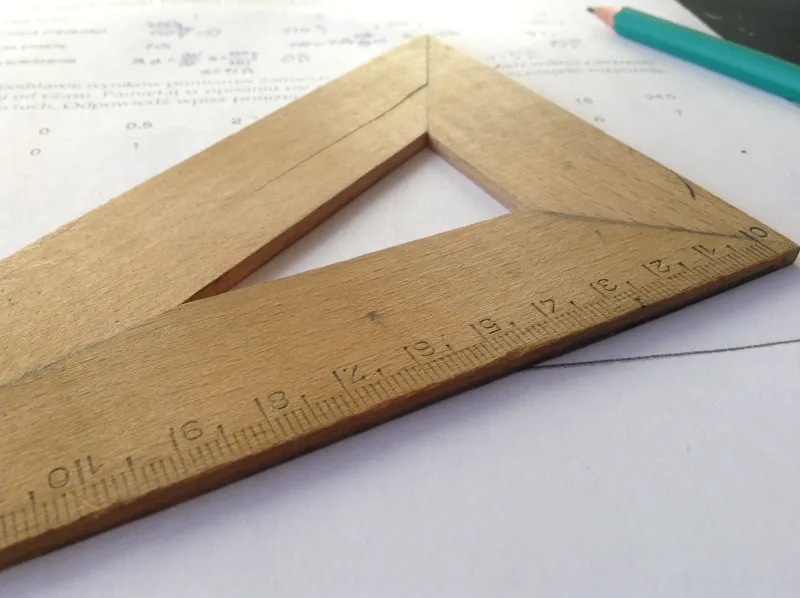
Now work in pairs. For each pair of seeds, find the halfway point along the imaginary line between them. Draw a line through that halfway point at right angles to the joining line. That line is where the two sites are equally close. Repeat for the pairs that matter, then trim each line so that only the nearest-neighbour boundaries remain. A compass-and-ruler construction works well; so does a ruler and a lot of cheerful arguing.
Another method is the growing-circles trick. Imagine a circle expanding from each seed at the same speed. When two circles touch, their meeting point is on the boundary. Keep growing and the touching points trace out the Voronoi edges. It is a lovely physical way to feel why the lines appear where they do.
Why the real lines wobble
Leicester’s actual ward boundaries do not behave like perfect Voronoi cells. They bend around the River Soar and the Grand Union Canal. They follow roads, railways and long-established neighbourhood edges. They try to keep communities together, balance electorate numbers, and respect polling districts. A straight line that is mathematically elegant can be administratively awkward if it splits a street, a school catchment or a natural community.
This is where the model becomes a conversation starter. The Voronoi map says, in effect: if distance were the only thing that mattered, this is how the city would fall apart into nearest-site patches. The real map says: distance is not the only thing that matters. Both statements are true, and the gap between them is where the interesting maths lives.
Testing a point, testing a map
Pick a specific point — the entrance to Leicester Market, a bench in Victoria Park, a corner outside the Curve. Measure to your chosen seed points, list the distances in order, and name the winner. That is your predicted cell. Then compare it with the official ward map. If they disagree, do not treat it as a failure. Ask why.
Was the nearest site really the right one to use? Does a straight line cross a river with no bridge? Would walking distance give a different answer? Is there a community centre, school or GP surgery that the map ignores but local people would not? A map is always a simplification, and testing a single point is a quick way to reveal its choices.
What the map leaves out
Every Voronoi diagram begins with a decision about where to put the seeds. That decision is not neutral. Put the seeds at libraries and you get one city. Put them at secondary schools and you get another. Put them at football grounds and you get a third, possibly chaotic, but very entertaining version. The boundaries are not just discovered; they are consequences of what you chose to count.
Real maps leave things out too. They may not show how people actually travel, where communities feel attached, or which route is blocked by a dual carriageway. They may use population rather than distance, history rather than geometry. Noticing those omissions is a mathematical skill as much as a geographical one.
A classroom challenge
Give groups a simplified Leicester outline and a set of landmark cards. Ask each group to build a nearest-landmark map, then compare maps. Why did their boundaries differ? Which seed points were doing the most work? What would happen if they added a new seed, such as a hospital or a park? Can they design a map for the nearest park, the nearest library, or the nearest bus stop?
Finish with the big question: what would you need to know to draw a fair boundary? Distance is a good place to start. It is never the whole story — and that is exactly why it is worth drawing.