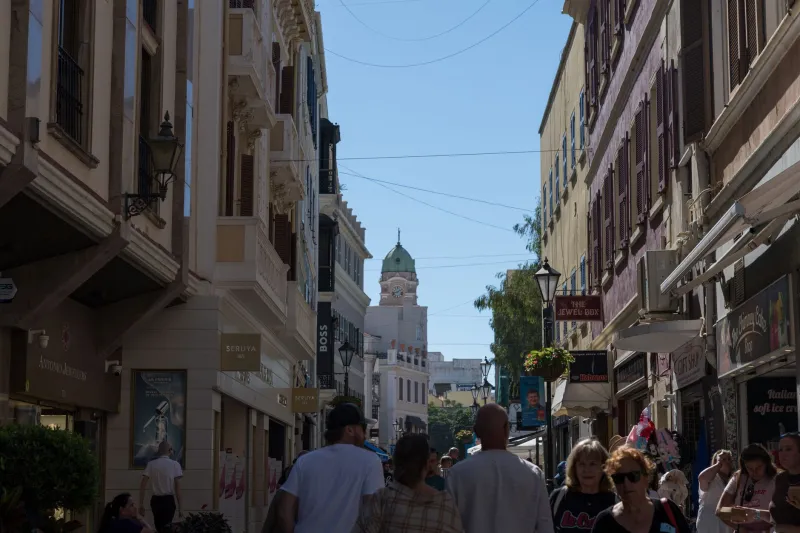
Why the Shortest Queue Can Lose: Lunchtime Lessons from Leicester Market
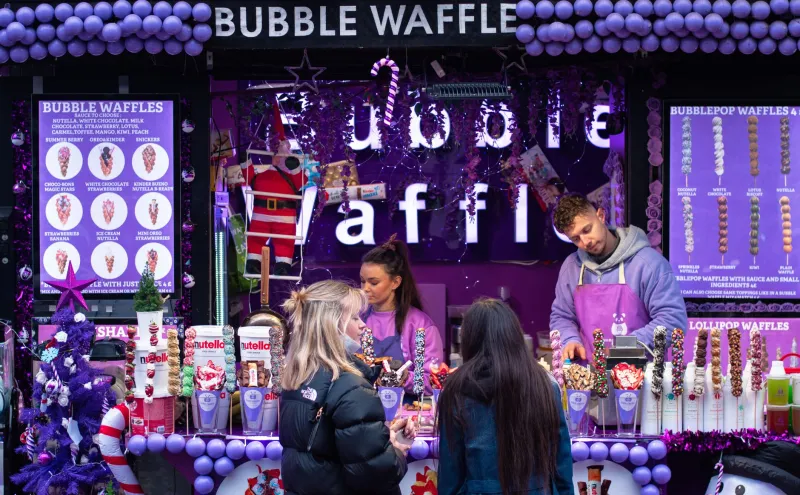
At half past twelve, Leicester Market becomes a small study in applied maths. One food stall has four people waiting. Another has two. Most of us pick the shorter line and feel smug for about ninety seconds. Then the person at the front of the short queue orders four baps with different fillings, the server disappears to find change, and the longer queue starts moving like a well-oiled machine.
Queueing theory is the branch of maths that tries to make sense of this. It does not promise that you will always choose the fastest line. It does something more useful: it gives you the language to ask better questions. How fast are customers arriving? How long does each order take? How many servers are working? And how much variability is hidden behind that cheerful handwritten menu?
Arrivals, service and the shape of a wait
In queueing theory, we often talk about an arrival rate and a service rate. The arrival rate is the number of customers joining the queue per unit of time. The service rate is how many customers one server can deal with per unit of time. If customers arrive faster than they can be served, the queue grows. If service is faster than arrivals, the queue shrinks or disappears.
But averages can be misleading. A stall might serve an average of one customer every 45 seconds, yet still have a five-minute wait because one order is a tray of six teas and another is a plain sausage bap. Variability matters. A short queue can be a queue of quick orders, or it can be a queue of one very slow order and one customer who has not decided yet. The length of the line tells you what has already happened. It does not tell you what is about to happen.
Little's Law in a lunch queue
One of the most elegant ideas in queueing theory is Little's Law. In its simplest form it says:
L = λ × W
Here L is the average number of customers in the system, λ is the average arrival rate and W is the average time a customer spends in the system. You can rearrange it to estimate waiting time: W = L ÷ λ.
Suppose 30 customers arrive per hour at a stall, and on average there are 5 customers in the system, counting both the queue and the person being served. Then the average time in the system is 5 ÷ 30 hours, which is 10 minutes. That is a rough estimate, not a prophecy. It assumes the system is roughly steady, which lunchtime queues often are not. But it is a useful sanity check. If a queue looks short but the arrival rate is high and service is slow, the short queue may be a trap.
Collect a tiny dataset
You do not need a clipboard and a lab coat to test this. Pick two food stalls at Leicester Market and observe for 20 minutes. Keep it simple, polite and out of the way. A small table works well:
| Time | Stall | People in queue when you arrive | People served ahead of you | Service time for each customer | Total wait |
|---|---|---|---|---|---|
| 12:30 | A | 4 | 4 | 40s, 75s, 50s, 120s | 4m 45s |
| 12:32 | B | 2 | 2 | 30s, 180s | 3m 30s |
From this you can calculate an average service time for each stall, estimate the arrival rate by counting how many people join over the 20 minutes, and compare the queue length with the actual wait. You will quickly find that the shortest queue is not always the fastest. Sometimes it is, but now you have evidence rather than a hunch.
Simulation: two queues or one shared line
Here is a tabletop activity that makes the point vividly. Create 12 customer cards. On each card write an arrival time and a service time. For example: arrives at 0:00, needs 30 seconds; arrives at 0:20, needs 90 seconds; arrives at 0:50, needs 2 minutes. Use a mixture of quick and slow orders, because real lunch queues are lumpy.
Now run two scenarios. In the first, set up two separate queues, one for each server. Customers must choose a queue when they arrive. In the second, use one shared queue feeding both servers, so whoever is free takes the next customer.
Most groups find that the shared queue is more efficient overall, because a free server cannot sit idle while a separate queue has customers waiting. But the separate queue can still win for an individual customer who happens to pick the fast line. That is the tension. Queueing theory is not about guaranteeing your personal best outcome. It is about understanding the system that produces the outcomes.
What to do at 12:30
When you are next in Leicester Market, look beyond the length of the line. How many servers are working? Is the person at the front ordering something complicated? Is the queue moving steadily or in bursts? A longer queue with two servers may beat a shorter queue with one. A short queue at a stall where the server is also frying onions may be an illusion.
And if you collect data, do it kindly. Do not stare, do not get in the way, and do not turn a lunch break into an interrogation. A few observations, a rough table and a bit of arithmetic are enough to turn a everyday wait into a genuine problem-solving exercise. The shortest queue can lose. The maths helps you see why.